During my PhD research there was one piece of information that surprised me the most and led me to rethink the ways I understand waste. My work is focused on the material politics of plastics and how the European Union (EU) regulates these materials. This is my account of that encounter and a reflection on what it means for my work and for opening up directions on future work of STS on waste.
While reading the Discard Studies blog, I encountered this information: in the United States, 3% of waste is Municipal Solid Waste and 97% is Industrial Solid Waste (Liboiron, 2013). I was very surprised by these numbers and what they point to, even if as an STS PhD student I am trained to think twice about statistics. Since these numbers came from a North American context, I was curious to see what is reported in the EU.
“Municipal waste accounts for only about 10 % of total waste generated when compared with the data reported according to the Waste Statistics Regulation (tab env_wasgen). However, it has a very high political profile because of its complex character, due to its composition, its distribution among many sources of waste, and its link to consumption patterns.” (Eurostat, 2021, my highlight)
In the EU, of all waste generated about 10% comes from municipal waste management. Please do not skip that number as just another statistic. Indeed, these numbers can be challenged in many ways from an STS perspective (and not only). There are big issues with what is counted, who counts, how things are counted and how it is reported back to the European Commission and other EU institutions. The waste categories themselves present a black box to be opened (as I will discuss at the end of this article). Therefore, I do not suggest taking these number in face value. However, I still believe that they point to something interesting and worth discussing if we think through that numbers. So, let’s do that.
First, what is municipal waste? According to Eurostat:
“Municipal waste consists of waste collected by or on behalf of municipal authorities and disposed of through waste management systems. Municipal waste consists mainly of waste generated by households, although it also includes similar waste from sources such as shops, offices and public institutions.” (Eurostat, 2013)
Municipal waste here is a large category that covers post-consumer waste. That means all waste that passed through our hands as consumers; all of what we touch and throw away in bins then collected by municipalities. It is the waste often targeted at campaigns on reducing waste, or of zero waste, or no more plastic waste. It is the category of waste that I have encountered most in my PhD work when discussing with stakeholders and reading on the regulation of plastics in the EU which set measures on banning single use plastic items from the market, minimum recycling contents in products, proper labelling, producer responsibility schemes, and awareness raising campaigns. All of that is referring to municipal waste, representing about 10% of the total waste generated in the EU.
What I find interesting is how the above quote by Eurostat reporting that municipal waste is 10% of the total waste generated, is at the same time, a justification of why this category of waste is still significant. They state that even if only 10% of the total waste is municipal waste, this kind of waste has a high political profile. Eurostat’s need to justify the political importance of municipal waste, in light of the statistic provided, points to a certain mainstream understanding which wants municipal waste to be the most significant and most discussed waste category. And therefore, reporting that municipal waste is only the 10% of the total waste demands that further justification. I am wondering how that 10% of municipal waste is more political than the kinds of waste making up the other 90%?
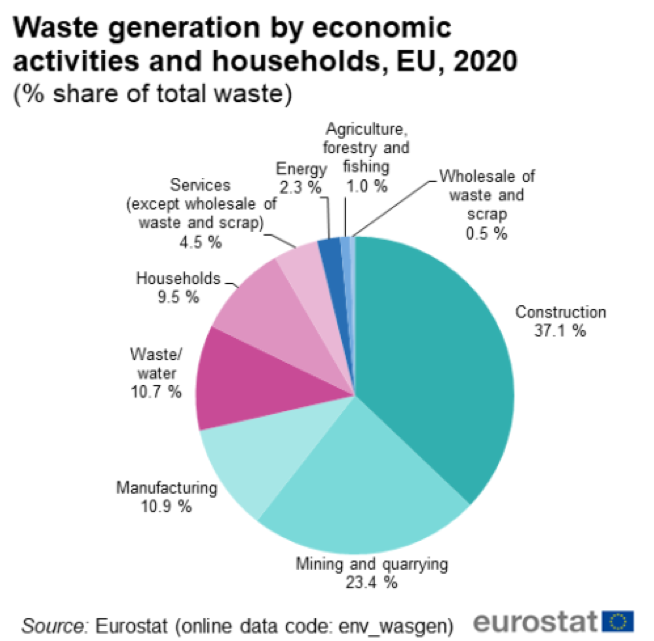
According to the Eurostat pie chart shown above, waste generated by economic activities is the rest 90,5% of total waste generated.
Economic activities shown in the chart are mainly industrial processes. The 9.5% is all the household waste, all that goes through households (the major source of municipal waste). In my view, that 90.5% is not of a less ‘political profile’ that the rest, but certainly much less the focus of attention of political discussions.
To go back to the numbers and counting. I do not wish to uncritically assume that when something is less in percentage means it is also less in significance. These numbers are measuring waste in tonnes. It is the weight of waste counted. The multidimensional harms that waste can have cannot be reduced to such a measurement. There is chemical pollution for example which cannot be addressed in a simple dosage manner. The case of endocrine disruptors in plastics have challenged threshold ideas of pollution demonstrating how a small dosage can have indeed large effects (Liboiron, 2016). That means that for waste, less weight does not necessarily mean less harm. Waste and pollution are way more complicated than that and require situated and detailed empirical work to address such questions. I also do not want to argue that studying and doing research on household and municipal waste is less relevant or less significant because municipal waste represents a small fraction of the total waste in weight. However, I cannot fail to notice that there is a disproportionate focus on household waste normalised as ‘the waste’ which has significant material implications in (STS) research and beyond. In the words of Josh Lepawsky:
“It is crucial to notice this invisibility of waste. When our notion of what waste is and where it comes from is so strongly informed by what we think we know about waste because we have direct daily experience with it through the bins in our homes or the cans we put out on the curb, we have a very partial knowledge of waste. The partiality of that knowledge has practical consequences for how we might imagine solutions to waste problems” (Lepawsky. 2018: 14)
The reason I was shocked by the idea that less than 10% of waste is municipal waste in the EU, is because my view of waste was limited to household waste in a very subtle way (even if I was doing research involving plastic waste!). In fact, even now that I am aware that most of the waste, in weight, is not household waste, because of my practical material experiences it is so hard to even imagine these different kinds of waste in industrial settings. Is it that I did not know that industries create waste? No. Of course I knew that somehow. Nevertheless, my imaginary capacity to picture and grasp what these wastes are is still very limited. And that capacity of mine of course shapes the kinds of research questions I am keen on pursuing. It shapes my gaze on waste.
Concluding this writing, I believe that there is so much to be explored and gained from an STS perspective on waste, but I want to point to an area of personal interest: bureaucracy. I therefore want to echo Reno (2015) who calls ethnographers to look at waste management regimes and add that there is a lot to be gained from an STS focus on waste management and policies. In my work I have encountered how seemingly easy categories and definitions of objects, such as the plastic bag or single-use plastics, are so difficult to define in EU policy. These material categories become the focus of political debates and open up ways to explore socio-material relationships in contemporary societies. These categories and definitions are political, and they shape the world in materials terms (Bowker and Star, 1999). Unpacking waste categories and ways in which waste, not limited to municipal waste, are counted and defined in bureaucratic practices of waste management can help and contribute greatly to proposed solutions and envisioning better futures of life with materials, chemicals and waste.
Bibliography
Bowker GC and Star SL (1999) Sorting Things Out: Classification and its Consequences. Cambridge, Mass: MIT Press.
Eurostat (2013) Glossary: Municipal waste. Available at: https://ec.europa.eu/eurostat/statistics-explained/index.php?title=Glossary:Municipal_waste (accessed 20.11.2022).
Eurostat (2021) Municipal waste statistics. Available at: https://ec.europa.eu/eurostat/statistics-explained/index.php?title=Municipal_waste_statistics (accessed 20.11.2022).
Lepawsky J (2018) Reassembling Rubbish : Worlding Electronic Waste. Boston: MIT Press.
Liboiron M (2013) The Politics of Measurement: Per Capita Waste and Previous Sewage Contamination. In: Discard Studies Blog. 22 April. Available at: https://discardstudies.com/2013/04/22/the-politics-of-measurement-per-capita-waste-and-previous-sewage-contamination/ (accessed 20.11.2022).
Liboiron M (2016) Redefining pollution and action: The matter of plastics. Journal of Material Culture 21(1): 87-110.
Reno J 2015. Waste and waste management. Annual Review of Anthropology 44:557-572.